Codebit Solutions is a leading Prometheus & Grafana Consulting & Observability Company helping startups, SMEs, and enterprise organizations across India, USA, UK, Canada, and Australia design, deploy, and scale real-time monitoring dashboards, Prometheus Alertmanager notifications, Loki log aggregation, Tempo distributed tracing, and Kubernetes metrics stack.
# Prometheus Alert Rule & PromQL
groups:
- name: k8s-node-alerts
rules:
- alert: HighNodeCPU
expr: rate(node_cpu_idle[5m]) < 0.15
for: 5m
labels: { severity: 'critical' }
Undetected application downtime, silent database performance bottlenecks, un-alerted microservice memory leaks, and fragmented log management compromise enterprise reliability. Prometheus & Grafana provide full-stack, real-time metrics, logs, and distributed tracing.
Collect time-series metrics from Kubernetes pods, microservices, databases, and cloud infrastructure via Prometheus PromQL queries.
Build role-based executive, DevOps, and developer dashboards unifying Prometheus metrics, Loki logs, and Tempo traces.
Configure Alertmanager rules with deduplication, inhibition, and routing to Slack, PagerDuty, Opsgenie, and MS Teams.
Prometheus and Grafana form the CNCF gold standard for open-source cloud-native monitoring, offering zero vendor lock-in, infinite customization, and high-performance PromQL queries.
From microservice performance to global multi-cluster telemetry, Prometheus & Grafana deliver complete infrastructure visibility.
Query real-time infrastructure and application metrics with mathematical precision using Prometheus PromQL.
PromQL EngineSingle pane of glass visualization connecting 100+ datasources including Prometheus, Loki, CloudWatch, and MySQL.
Single Pane GlassAutodiscover pods, nodes, endpoints, and ingress controllers with Prometheus Operator and ServiceMonitors.
K8s DiscoveryAggregate cluster logs efficiently without expensive full-text indexing, querying logs side-by-side with metrics.
Grafana LokiTrace distributed microservice requests end-to-end to pinpoint latency bottlenecks across complex architectures.
Tempo & OTelEliminate exorbitant per-GB SaaS monitoring bills while maintaining complete data ownership and security compliance.
Low TCOAs a specialized Prometheus & Grafana Consulting & Engineering Company, Codebit Solutions provides end-to-end monitoring setup, custom Grafana dashboard engineering, Alertmanager routing, Loki log aggregation, and long-term Thanos/Mimir retention.
Design scalable time-series monitoring, long-term metric storage (Thanos/Cortex/Mimir), and HA deployment.
Deploy Prometheus Operator on EKS, AKS, GKE, and on-premise Kubernetes clusters with CRD automation.
Design interactive, executive, and technical dashboards for microservices, JVM, Node.js, PostgreSQL, and K8s.
Configure Alertmanager rules, silences, inhibition, and multi-channel routing to Slack, PagerDuty, and Opsgenie.
Install Promtail/Fluentbit and Grafana Loki for centralized, cost-effective log collection and LogQL querying.
Instrument microservices with OTel SDKs and deploy Grafana Tempo for distributed request tracing.
Configure Thanos or Grafana Mimir for multi-year metric retention with S3/GCS object storage.
Integrate Okta, Azure AD, OAuth2, and SAML SSO with team dashboards, folder permissions, and SOC 2 security.
Audit cardinality explosion, optimize Prometheus memory consumption, tune scrape intervals, and refine queries.
Our observability solutions empower engineering, DevOps, SRE, and product teams to detect issues before customers notice.
Prometheus & Grafana are ideal for cloud-native Kubernetes microservices, financial transaction systems, and high-scale SaaS products.
Centralized Prometheus & Grafana Mimir monitoring across dozens of multi-region EKS, AKS, and GKE clusters.
Track Service Level Indicators (SLIs) and Service Level Objectives (SLOs) with real-time error budget alerting.
Real-time dashboards and alerts for PostgreSQL, MySQL, MongoDB, Redis, and Elasticsearch metrics.
Connect Alertmanager triggers to PagerDuty / Opsgenie on-call schedules and automated incident creation.
Monitor CPU/RAM requests vs limits in Kubernetes to right-size cluster nodes and cut cloud bills.
Deploy Grafana Synthetic Monitoring / Blackbox Exporter for global ping, HTTP, and SSL certificate monitoring.
End-to-end tracing visualizing latency bottlenecks across microservices using Tempo and OpenTelemetry.
Query container logs, NGINX access logs, and application stack traces correlated directly with metric spikes.
Build immutable audit dashboards tracking user logins, config changes, and infrastructure security alerts.
Every industry operates on specific uptime SLAs, user concurrency, and compliance requirements. Our Prometheus & Grafana consulting services deliver reliable, real-time observability across all domains.

Prometheus time-series monitoring for Agritech IoT gateways, weather telemetry, and field sensors.

Grafana APM dashboards monitoring travel booking latency, API errors, and payment gateway health.

Industrial IoT telemetry monitoring with Grafana alerts for factory equipment uptime and ERP servers.
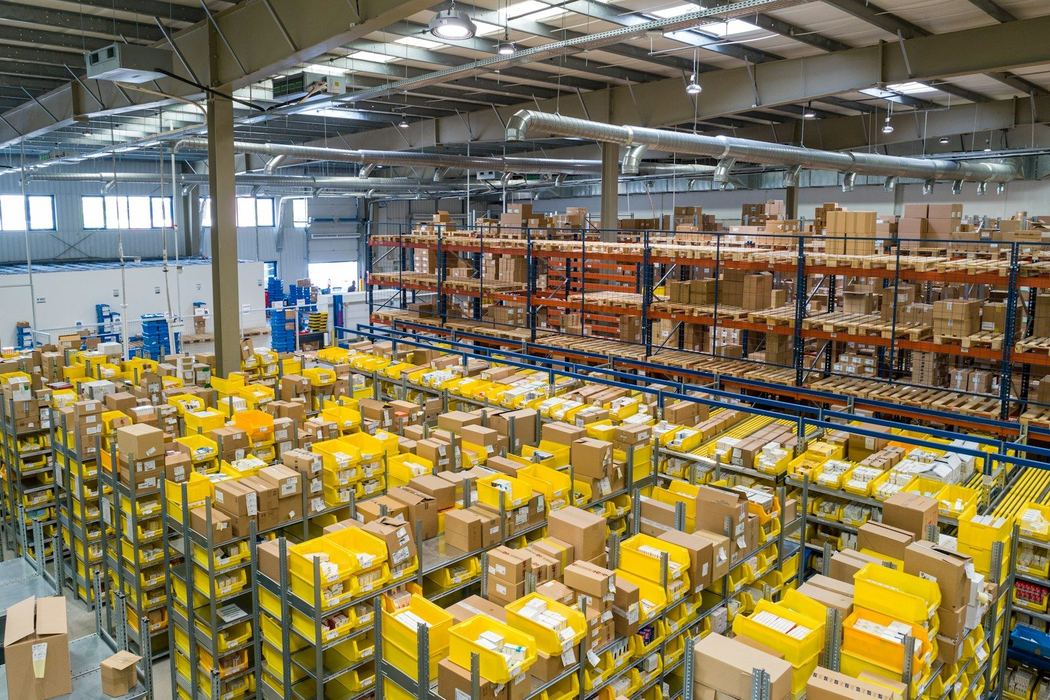
Prometheus Alertmanager routing for fleet tracking microservices and warehouse dispatch APIs.
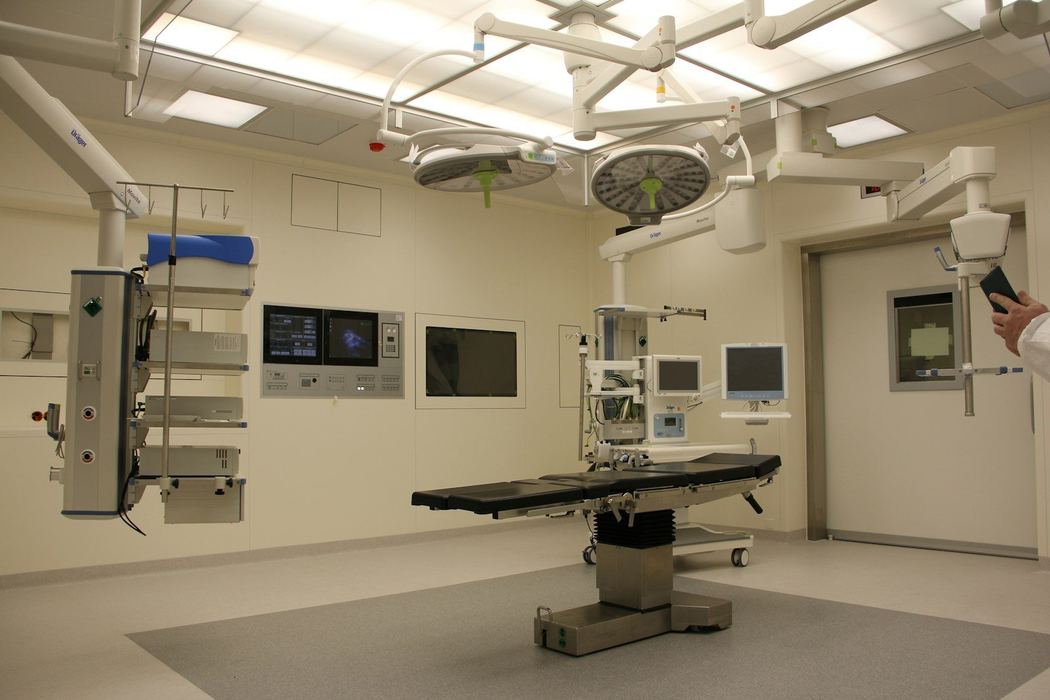
HIPAA-compliant Grafana Loki log auditing and real-time medical API performance dashboards.

Real-time metrics for virtual classroom video servers, LMS portals, and exam concurrency spikes.

Prometheus metric tracking for property portal search queries, database IOPS, and web servers.

High-frequency checkout metrics, shopping cart error rates, and Redis cache hit ratio alerts.

SOC 2 compliant observability stack with Grafana Enterprise SAML SSO, Tempo APM, and Thanos HA.
We follow a proven 6-step engineering process to audit, architect, install, secure, automate, and optimize observability platforms.
Businesses choose Codebit Solutions because we combine deep Cloud Native Computing Foundation (CNCF) observability expertise, Grafana & Loki mastery, and enterprise telemetry engineering.
Certified Kubernetes & Observability engineers with deep hands-on Prometheus and Grafana production experience.
Proven capability designing stunning Grafana dashboards and high-performance LogQL queries over Loki log clusters.
Instrumenting microservices with OpenTelemetry SDKs and Grafana Tempo for end-to-end distributed tracing.
Configuring multi-year metric storage and global query deduplication using Thanos and Grafana Mimir.
Saving client organizations thousands of dollars per month by migrating expensive SaaS APM tools to open-source stacks.
24/7 observability stack health monitoring, scraper troubleshooting, version upgrades, and SLA support.
Codebit Solutions helps businesses, startups, and enterprises implement real-time Prometheus & Grafana telemetry tailored to zero-downtime microservice scale.
Find answers to common questions about our Prometheus & Grafana Consulting Services, Alertmanager routing, Grafana Loki, Tempo tracing, and long-term metric storage.